Announcing the GitHub Innovation Graph
## Metadata
- Author: [[Mike Linksvayer]]
- Full Title: Announcing the GitHub Innovation Graph
- Category: #articles
- Document Note: ---
tags:
- #GitHub
- #InnovationGraph
- #OpenSource
- #Data
- #Policy
- #DeveloperRelations
- #WordPress
- #OSPO
- #Education
- #Economics
Author: Mike Linksvayer
Source: GitHub Blog
Reference: https://github.blog/2023-09-21-announcing-the-github-innovation-graph/
date created: 2025-08-22 00:00
---
# Title: Announcing the GitHub Innovation Graph — Open Data on Global Software Development
## Table of Contents:
- [📝 Summary](#-summary)
- [📖 Main Content](#-main-content)
- [🗒️ Notes](#️-notes)
- [📖 References](#-references)
- [🗣️ Paraphrase](#-paraphrase)
- [📰 Newsletter](#-newsletter)
- [✅ Action Items](#-action-items)
- [🧪 Hypotheses](#-hypotheses)
- [📊 Methodology](#-methodology)
- [❓ Questions](#-questions)
- [🔮 Future Research](#-future-research)
- [💡 Implications](#-implications)
- [🧠 Learning Styles Assessment](#-learning-styles-assessment)
- [📊 Accessibility Assessment](#-accessibility-assessment)
- [🌍 DEIB (Diversity, Equity, Inclusion, and Belonging) Assessment](#-deib-diversity-equity-inclusion-and-belonging-assessment)
- [✅ Logical validity](#-logical-validity)
- [🔍 DARVO Analysis](#-darvo-analysis)
- [🔍 SEO Evaluation](#-seo-evaluation)
- [🎯 Conclusion](#-conclusion)
### References:
- GitHub announcement with overview and methodology repository
- Research cited regarding OSS impact on startups, innovation, and GDP (as referenced in the article)
- Quote by Frank Nagle of Harvard Business School
## 📝 Summary:
GitHub introduced the Innovation Graph, an open data and insights platform offering quarterly, longitudinal metrics about global software development since 2020. It aggregates and publishes data on Git pushes, developers, organizations, repositories, languages, licenses, topics, and cross-economy collaboration. The aim is to make GitHub activity data accessible to researchers, policymakers, and developers, reducing barriers to analysis and enabling evidence-based policy, research, and community understanding. Data is downloadable under CC0-1.0, accompanied by visualizations and a public methodology. GitHub plans ongoing improvements and periodic insight reports.
## 📖 Main Content:
The Innovation Graph reframes how we measure innovation by centering developer activity and collaboration rather than relying solely on traditional proxies like patents or academic papers. It supplies quarterly series, per economy, for multiple developer-centric metrics and encourages reuse via a public website and repository. The primary audiences are:
- Researchers: access to consistent, aggregated, longitudinal GitHub data for cross-country and regional analysis without requiring proprietary third parties.
- Policymakers: evidence to design programs that promote digital transformation, workforce development, and regional innovation ecosystems.
- Developers: context to understand how their interests (languages, topics) and collaborations fit within global trends.
The article cites research suggesting open source contributions correlate with more startups, higher innovation, and significant GDP effects. It positions the Graph as scaffolding for more rigorous, reproducible studies and for narratives that illustrate the public-good nature of open source.
GitHub invites community feedback through issues in the repository and commits to releasing additional insight reports to deepen interpretation and inform action.
### 🗒️ Notes
- Problem statement:
- Traditional innovation metrics emphasize patents and papers; software development trends have been harder to measure reliably.
- Solution overview:
- Launch of the GitHub Innovation Graph as an open data platform with visualizations and a public methodology repository.
- Data cadence: quarterly; coverage starting 2020.
- Scope of metrics: Git pushes, developers, orgs, repos, languages, licenses, topics, and collaborators across economies.
- Licensing: CC0-1.0, enabling unrestricted reuse.
- Audiences and benefits:
- Researchers: lower barriers to data access; aggregated, standardized time series.
- Policymakers: ability to link developer activity to economic development and digital transformation initiatives.
- Developers: understand collaboration patterns and language/topic trends globally.
- Quote:
- Frank Nagle emphasizes open source as a public good and the Graph’s role in understanding and securing it.
- Economic and innovation angle:
- Points to research associating GitHub OSS contributions with startups, innovation, and GDP gains.
- Expectation: more accessible data will catalyze further research and policy supporting developer opportunity.
- Community call-to-action:
- Explore trends, build visualizations, showcase how contributions map to broader patterns.
- Open issues for feedback; GitHub to release ongoing insight reports.
## 📖 References:
- GitHub announcement and repo with methodology and data (CC0-1.0)
- Research linking OSS activity to economic outcomes (as noted in the article)
- Frank Nagle, Harvard Business School, commentary on OSS as a public good
## 🗣️ Paraphrase:
1) Original idea: Innovation metrics have long prioritized patents and papers; researchers and policymakers lack reliable software development data. The Innovation Graph addresses this gap.
Paraphrase: For years, innovation was measured by counts of patents and journal articles, leaving a blind spot around day-to-day software creation. Because dependable, global software data has been hard to obtain, GitHub is launching the Innovation Graph to make developer activity measurable and comparable over time.
2) Original idea: The Innovation Graph provides quarterly data since 2020 across pushes, developers, orgs, repos, languages, licenses, topics, and economy-level collaborators, with visualizations and downloadable CC0-1.0 datasets.
Paraphrase: The platform releases quarterly time series beginning in 2020, covering everything from commit activity to developer counts, organizations, repositories, programming languages, licensing, topical themes, and cross-border collaboration. It includes charts you can explore and raw datasets you can freely download and reuse under a permissive public domain license.
## 📰 Newsletter:
This week in Web Dev: GitHub just shipped the Innovation Graph—an open data trove on how the world builds software. Think quarterly, global time series since 2020 for pushes, devs, repos, languages, licenses, topics, and cross-economy collaboration. It’s CC0, comes with visualizations, and a public methodology so your hot takes can be reproducible. If you teach, maintain, or build policy decks, this is catnip.
Highlights:
- Track language and topic trends to guide your learning path.
- See collaboration patterns across regions to spot emerging hubs.
- Use the data to argue for funding your next OSS initiative (with receipts).
Start exploring via the official announcement on the GitHub Blog. If you have ideas, GitHub wants feedback through issues on their repo—open source vibes all the way.
## ✅ Action Items:
A tailored prompt to align each article with your role (GoDaddy Developer Advocate, OSS/WordPress educator, future OSPO director):
“Analyze how this article advances open-source advocacy, contributor engagement, and developer education within the WordPress ecosystem and broader web. Map key insights to:
- Advocacy: Identify data or arguments useful for funding proposals, sustainability models, and policy engagement (e.g., correlating OSS activity with startups and GDP).
- Contributor Onboarding: Extract actionable learning paths, mentorship opportunities, and community programs informed by language/topic trends and regional collaboration data.
- Education: Propose curricula and workshops connecting Git, GitHub, PHP/JS/HTML/CSS fundamentals to real Innovation Graph trends. Include measurable outcomes.
- OSPO Strategy: Recommend policies on licensing, contributor recognition, metrics dashboards, and transparency practices guided by the Innovation Graph methodology.
- DEIB and Transparency: Suggest inclusive practices and reporting standards to ensure broad participation, equitable recognition, and open governance.
- WordPress Alignment: Surface implication
- Summary: GitHub has announced the launch of the GitHub Innovation Graph, a platform that provides open data and insights on the global and local impact of developers. The Innovation Graph includes longitudinal metrics on software development for economies worldwide, offering quarterly data on various aspects of development. It aims to provide reliable data on global trends in software development, which has been lacking in the past. The platform is expected to be useful for researchers, policymakers, and developers, and GitHub plans to release new insight reports over time.
- URL: https://github.blog/2023-09-21-announcing-the-github-innovation-graph/
I’m excited to announce the launch of the [GitHub Innovation Graph](https://github.blog/2023-09-21-announcing-the-github-innovation-graph/innovationgraph.github.com), our open data and insights platform on the global and local impact of developers. For too long, measures of innovation have focused solely on things like patents and research papers, while policymakers and researchers have had trouble finding reliable data on global trends in software development. GitHub’s solution is the Innovation Graph.
#### What is it?
The Innovation Graph includes longitudinal metrics on software development for economies around the world. Launched today with a dedicated [webpage](https://github.blog/2023-09-21-announcing-the-github-innovation-graph/innovationgraph.github.com) and [repository](https://github.com/github/innovationgraph), it provides quarterly data on Git pushes, developers, organizations, repositories, languages, licenses, topics, and economy collaborators, dating back to 2020. The platform offers a number of data visualizations, and our repository outlines our methodology. Data for each metric (licensed [CC0-1.0](https://creativecommons.org/publicdomain/zero/1.0/)) is available to download.
#### Who it’s for
We expect the Innovation Graph will be useful for researchers, policymakers, and developers alike. In [research](https://socialimpact.github.com/assets/img/research/GitHub_StandardizedMetrics.pdf) commissioned by GitHub, consultancy Tattle found that researchers in the international development, public policy, and economics fields were interested in using GitHub data but faced many barriers in obtaining and using that data. We intend for the Innovation Graph to lower those barriers. Researchers in other fields will also benefit from convenient, aggregated data that may have previously required third-party data providers if it was available at all.
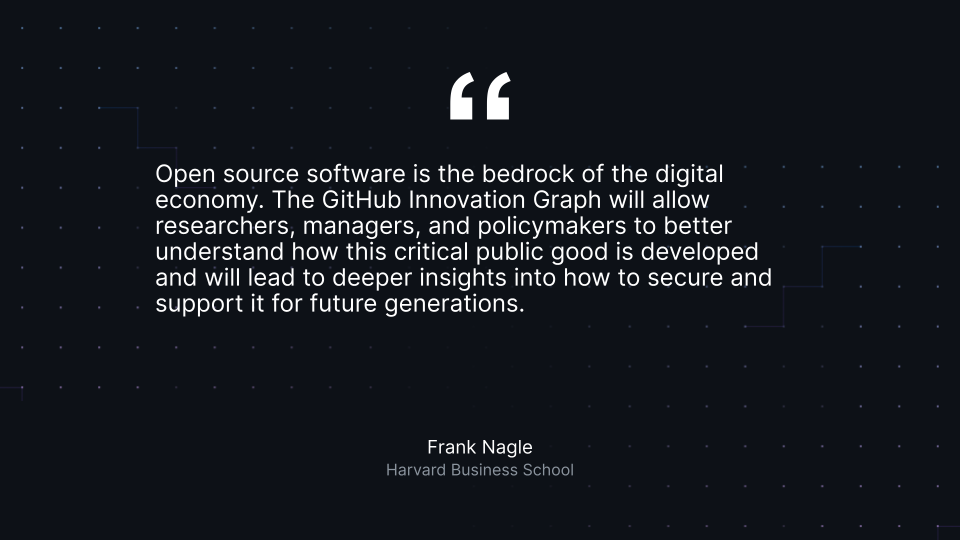Frank Nagle quote
Promoting digital transformation and well-paid jobs is a key goal for many policymakers. We’re encouraged to see some research indicating that open source contributions on GitHub are associated with [more startups](https://www.sciencedirect.com/science/article/pii/S0048733323001300), [increased innovation](https://github.blog/2022-10-06-developers-are-now-included-in-the-wipo-global-innovation-index/), and [tens of billions of euros in GDP](https://digital-strategy.ec.europa.eu/en/news/commission-publishes-study-impact-open-source-european-economy#:~:text=The%20study%20predicts%20that%20an,start%2Dups%20in%20the%20EU.), and expect that more easily accessible data will make for more (and compelling) research, and ultimately more policies that foster developer opportunity–and more opportunity for anyone to be a developer.
Developers will be able to see and explore the broader context for their contributions, for example, how developers collaborate across the global economy, or how the particular language or topic they are interested in is trending around the world.
#### What to do with it
We’re releasing the Innovation Graph as a data resource for community reuse, and are excited to see what you build! We think there are opportunities to explore data trends, inform research, make beautiful visualizations, and for developers to show how their contributions relate to broader trends.
Over time, we’ll continue to release new insight reports on topics of interest to policymakers, researchers, and developers.
If you have ideas on how we can improve the Innovation Graph, please open an issue in the [repository](https://github.com/github/innovationgraph). We’re committed to ongoing improvements, so that the Innovation Graph can best demonstrate the impact of developer collaboration around the world.
[Subscribe](https://github.blog/2023-09-21-announcing-the-github-innovation-graph/#newsletter), Announcing the GitHub Innovation Graph, Mike Linksvayer, 01haygtm82r2v2nwebvxc0we3p.