Part 1: My Life Is a Lie
## Metadata
- Author: [[Michael W. Green]]
- Full Title: Part 1: My Life Is a Lie
- Category: #articles
- Document Note: ```markdown
---
tags: [economics, inequality, poverty]
author: Michael W. Green
source: yesigiveafig.com
reference: [https://www.yesigiveafig.com/p/part-1-my-life-is-a-lie?utm_campaign=post&utm_medium=web]
date created: 2025-11-26 10:00
---
# 🏷️ Title: Part 1: My Life Is a Lie
## 🧭 Table of Contents
- [📝 Summary](#-summary)
- [📖 Main Content](#-main-content)
- [🗒️ Notes](#️-notes)
- [📚 References](#-references)
- [🗣️ Paraphrase](#️-paraphrase)
- [📰 Newsletter](#-newsletter)
- [✅ Action Items](#-action-items)
- [🧪 Hypotheses](#-hypotheses)
- [📊 Methodology](#-methodology)
- [❓ Questions](#-questions)
- [🔮 Future Research](#-future-research)
- [💡 Implications](#-implications)
- [🧠 Learning Styles Assessment](#-learning-styles-assessment)
- [📊 Accessibility Assessment](#-accessibility-assessment)
- [🌍 DEIB Assessment](#-deib-assessment)
- [✅ Logical Validity](#-logical-validity)
- [🛡️ DARVO Analysis](#-darvo-analysis)
- [🎯 Conclusion](#-conclusion)
### 🔗 References
- Include links cited in or relevant to the article.
## 📝 Summary
- The author discovers that the US poverty line is based on a 1963 “food-times-three” formula that no longer matches real household costs.
- Because housing, healthcare, childcare, and transport exploded while food stayed cheap, true “crisis” income for a family of four is closer to ~$140k.
- Stakeholders: working- and middle-class families, policymakers, economists, and beneficiaries of current metrics.
- Risks: policy built on a broken benchmark, political resentment, and economic fragility for anyone below ~$140k.
- Bottom line: the official poverty line measures starvation, not survival, and quietly misclassifies most US households.
## 📖 Main Content
- The author, a markets-focused analyst, realizes he never questioned “the poverty line,” which he assumed was neutral infrastructure. He finds that it’s defined as “three times the cost of a minimum food diet in 1963, adjusted for inflation.” Food once took ~33% of budgets, so the formula worked as a crisis floor when housing, healthcare, and childcare were cheap.
- Today, food is 5–7% of spending, while housing (35–45%), healthcare (15–25%), and childcare (20–40% for families with young kids) dominate. If you keep Orshansky’s logic but update food share, the multiplier jumps to ~16, pushing a family-of-four crisis threshold to roughly $130k–$150k; the author centers on ~$140k as the honest “too little” floor.
- He then builds a “Basic Needs” budget for a two-earner, two-child household: childcare (~$33k), housing (~$23k), food (~$15k), transport (~$15k), healthcare (~$11k), and other essentials (~$22k), requiring ~$118k net / ~$136.5k gross. This makes a median $80k household functionally in deep poverty under Orshansky’s own method.
- A “Participation Audit” shows that core “tickets” to participate in modern life (phone+internet, healthcare, taxes, childcare) have risen far faster than CPI, while food largely tracked CPI. The author distinguishes hedonic improvements (better goods) from the non-negotiable cost of participation.
- He identifies a “Valley of Death”: as income rises from ~$35k to ~$100k, means-tested benefits (Medicaid, SNAP, childcare subsidies) vanish faster than wages rise, creating cliffs at ~45k (healthcare loss) and ~65k (childcare subsidies loss). A family at $100k can be worse off in net terms than one at $40k.
- Below the real ~$140k line, households sit just above ruin: any shock can push them into eviction, bankruptcy, or default, which he frames as an economic “phase change” (from liquid to solid) that’s extremely hard to reverse.
- Covid lockdowns temporarily removed participation costs (childcare, commuting, work-related expenses), raising savings rates and making stagnant incomes feel rich—evidence that high fixed participation costs, not only wages, drive distress.
- Politically, the author argues this trap fuels anger from the “working poor” toward the very poor and immigrants: people see others receiving for free what they themselves buy with 60-hour weeks. The perceived breach of the American promise “effort → security” creates rage at institutions.
- Charts celebrated by economists as proof of prosperity (more families above $150k; falling official poverty) are reinterpreted: if real self-sufficiency is ~$140k, then that top bucket is merely the survival tier, and “poverty” statistics are actually tracking only starvation because food is uniquely cheap.
- He concludes that the true poverty line is ~\$140k, most “middle class” are actually working poor, and the system punishes people for trying to escape benefit eligibility. Promised wealth via 401(k)s and home equity may also be illusory, to be addressed in the next part.
### 🗒️ Notes
- Benchmark revelation: poverty line = “three times the cost of a minimum food diet in 1963, adjusted for inflation,” a seemingly apolitical number that underpins policy and narratives.
- Historical context: in 1963, single incomes could cover cheap housing, employer-provided healthcare, near-zero childcare costs, affordable college, and pensions—so food at ~33% made “food × 3” a sensible crisis floor.
- Structural shift: by 2024, food-at-home is ~5–7% of spending; housing 35–45%, healthcare 15–25%, childcare 20–40% (for young kids). Holding Orshansky’s logic constant implies a 16x food multiplier.
- Updated threshold: an honest application of the old method to current budget shares yields a crisis floor of roughly $130k–$150k; the author centers on ~$140k as a conservative but realistic line for a family of four.
- Basic Needs budget (two earners, two kids, no luxuries): childcare ~$32.8k, housing ~$23.3k, food ~$14.7k, transport ~$14.8k, healthcare ~$10.6k, other essentials ~$21.9k. Net required ≈$118k; gross ≈$136.5k.
- Childcare as trap: the second earner is effectively working to pay daycare, clearing only $1–2k/month extra while sacrificing time and increasing stress; yet on one income, the family can’t reach survival.
- Housing optimism: “serious” models often assume sub-$2k/month rent, but real markets near jobs show rents >$2.7k for basic family units, implying the author’s ~$140k line is conservative; realistic local costs push the line toward ~$160k.
- Participation vs. luxury: key idea is to price “tickets to participate” (phone+internet, commute, basic care) rather than product features. Example: a 1955 phone line at ~$5/month (~$58 today) vs. modern smartphone + broadband at ~$200/month.
- Participation Audit: healthcare (~14x inflation), FICA (~6x), childcare (from structurally $0 to ~$32k), with food as the only category roughly tracking CPI.
- Valley of Death:
- At ~$35k, heavy benefits (Medicaid, SNAP, childcare subsidies) ensure a capped deficit.
- At ~$45k, losing Medicaid means a raise yields lower net income (effective >100% marginal “tax”).
- Around ~$65k, loss of childcare subsidies causes expenses to jump more than pay, leading to “total collapse.”
- At ~$100k, a family can be in a worse monthly position than at ~$40k but is no longer “poor” on paper.
- Phase change & ruin: below ~$140k with high fixed costs, households are like super-cooled water—stable until a shock (car repair, medical bill) triggers instant “freezing” into bankruptcy/eviction, which is extremely hard to reverse due to lasting credit, housing, and employment barriers.
- Covid as natural experiment: when work-related costs (childcare, commuting, work clothes/food) were suspended and some income was replaced with stimulus/unemployment, savings spiked and families briefly experienced what life feels like without participation tax, even at modest incomes.
- Political psychology: altruism depends on surplus; the squeezed working poor, seeing others receive subsidized essentials, perceive betrayal of the “effort → security” social contract and redirect rage at both beneficiaries and institutions.
- Data visual misread: charts showing more households above $150k actually track inflation of non-discretionary baskets; charts of falling official poverty only show fewer people unable to afford “minimum food × 3” in a world where food is cheap but life is expensive.
- Core thesis: the US uses a broken, food-based benchmark that radically understates deprivation; real self-sufficiency requires incomes classified as “upper” in official stats, turning the “middle class” into working poor.
## 📚 References
- Mollie Orshansky’s original poverty-threshold work (Social Security Administration, 1960s).
- US Census Bureau: Official Poverty Measure (OPM) description and thresholds.
- BLS CPI data and historical household budget shares.
- Health insurance premium statistics for US families (e.g., KFF employer health benefits survey).
- Childcare cost reports (e.g., Economic Policy Institute, Child Care Aware of America).
- Housing market data (e.g., Zillow, HUD Fair Market Rents).
## 🗣️ Paraphrase
- The US still defines poverty using a formula tied to 1963 food budgets, even though today housing, healthcare, and childcare dominate household spending. If we reapply the original logic using current spending patterns, the true “too little to function” line for a family of four is closer to $140k than $31k, meaning many “middle class” families are actually in deep economic insecurity.
- As families climb from low wages into what’s officially classed as middle income, they lose Medicaid, food aid, and childcare subsidies faster than their pay increases, leaving them worse off in net terms. This “Valley of Death,” combined with high fixed participation costs, explains why people earning $60k–$100k feel poor, resent those receiving benefits, and remain one shock away from financial ruin, despite charts claiming poverty and hardship are shrinking.
## 📰 Newsletter
The latest essay from Michael W. Green (“Part 1: My Life Is a Lie”) isn’t about WordPress directly, but it’s essential context for anyone building tools for real people. Green dissects how a broken poverty benchmark hides the true cost of “participation” in modern life—housing, healthcare, childcare, connectivity.
For WordPress builders, this matters. If your users are effectively poor at $80k–$120k, pricing, onboarding, and product positioning must respect razor-thin margins of time and money. Consider:
- Lean, fast themes that don’t require constant hardware upgrades.
- Transparent, predictable pricing for plugins and hosting.
- Content that helps freelancers and agencies price sustainably in a squeezed economy.
Resources worth revisiting:
- WordPress.org’s [Theme Handbook](https://developer.wordpress.org/themes/) for performance-first design.
- The [Plugin Developer Handbook](https://developer.wordpress.org/plugins/) to keep extensions lightweight and maintainable.
- Guides on building membership and subscription sites that can offer sliding-scale pricing or scholarships.
In short: if participation in the web is a “ticket” people struggle to afford, our ecosystem should be obsessively efficient, accessible, and respectful of their constraints.
## ✅ Action Items
#### DevRel
- Map this “participation cost” framing into developer personas: ensure docs and examples assume constrained time, devices, and budgets.
- Create workshops showing how to build low-cost, low-resource WordPress solutions for small businesses and working-class users.
- Improve quickstarts that deploy production-ready, low-TCO stacks (caching, security, backups) with minimal cognitive overhead.
- Run campaigns highlighting case studies where WordPress helps communities reduce costs (e.g., replacing expensive SaaS with self-hosted).
- Survey developers on where economic pressures show up most (hosting, licenses, client churn) and feed that back into roadmaps.
#### OSPO
- Encourage open-source components that reduce dependency on expensive proprietary services (auth, analytics, marketing tools).
- Clarify licensing and compliance to avoid surprise legal or cost burdens on small organizations.
- Strengthen security processes (signing, SBOMs, coordinated disclosure) to prevent incidents that could financially devastate small operators.
- Promote upstream engagement where open tooling demonstrably lowers participation costs (e.g., cheaper infra, better caching).
#### Community
- Run maintainer clinics on sustaining projects without resorting to extractive monetization that preys on financially fragile users.
- Build contributor onboarding paths friendly to people with limited time (micro-tasks, async reviews).
- Provide transparent budget reports for community funds and sponsorships to build trust among economically stressed contributors.
- Coordinate cross-project drills (security, incident response) to protect communities from costly failures.
#### WordPress
- Core: prioritize performance, stability, and backward compatibility to reduce users’ upgrade and hosting costs.
- Core Performance: define metrics that map directly to lower hosting bills and better performance on cheap hardware.
- Core AI: ensure AI features are optional, transparent in cost, and work on modest infrastructure.
- **Core Program Team:** keep release cadences and expectations realistic for contributors with limited spare time.
- Mobile: optimize apps for low-end devices and intermittent connectivity.
- Playground: expand browser-based sandboxes so learners don’t need powerful machines or paid hosting to experiment.
- Community: create meetup kits focused on “doing more with less” (cheap hosting setups, free tooling).
- Training: develop curricula on building low-cost, sustainable sites and businesses.
- Marketing: tell stories about WordPress as an economic leveler, not just an enterprise platform.
- Support: maintain accessible, free support channels; document “cheapest stable setup” patterns.
- Design: emphasize usable defaults that don’t require paid add-ons to feel complete.
- Documentation: add examples for low-resource environments (shared hosting, old devices).
- Photos, TV, Polyglots: keep contributions lightweight and accessible to contributors with constrained bandwidth and time.
- Accessibility: ensure first-class experiences on assistive tech to avoid forcing users into expensive proprietary solutions.
- Meta, CLI, Hosting, Tide, Openverse, Themes, Plugins: align roadmaps around lowering total cost of ownership and avoiding dark patterns.
#### The WPCC
- Prioritize microgrants and stipends for maintainers whose open-source work tangibly reduces participation costs (e.g., performance plugins, accessibility tools).
- Fund documentation sprints that help agencies and freelancers build economically resilient services.
- Experiment with matched grants and milestone payouts tied to improvements in affordability, accessibility, and sustainability.
### FAIR
- Support local mirroring and verifiable metadata so communities can host and trust their own infra.
- Codify funding transparency and anti-capture rules so governance isn’t swayed by interests misaligned with economically vulnerable users.
- Ship governance templates (charters, scorecards) that embed cost-awareness and user impact as first-class metrics.
## 🧪 Hypotheses
- H1: When the poverty line is recalculated using updated budget shares, a majority of US “middle class” households fall below a realistic survival threshold.
- H2: Effective marginal tax rates (from benefit loss + taxes) between ~$40k and ~$100k exceed 70% for many families, discouraging additional work.
- H3: The Covid savings spike was driven more by reduced participation costs (childcare, commuting) than by income-side stimulus alone.
- H4: Political resentment toward welfare recipients and immigrants is strongly correlated with households whose incomes sit just below the real ~$140k survival line.
- H5: Charts using official poverty lines systematically understate material deprivation because they track food affordability rather than full participation costs.
### 📊 Methodology
- For H1: Build microdata-based budgets (CEX, CPS) by income decile; define a “participation bundle” (housing, childcare, healthcare, transport, connectivity) and compute the minimum income needed per family type. Compare with official thresholds.
- For H2: Model marginal effective tax rates (METRs) across income using benefit schedules (Medicaid, SNAP, childcare subsidies) plus federal/state tax codes.
- For H3: Decompose personal savings rate changes into components attributable to income transfers vs. spending collapses in participation categories; run regressions by household type.
- For H4: Use survey data on attitudes toward benefits/immigration, matched to local income and cost-of-living data, to test correlations controlling for education and partisanship.
- For H5: Compare multidimensional poverty indices (incorporating housing, childcare, healthcare) against official food-based measures across time and geography.
### ❓ Questions
- How would US policy priorities change if the official poverty line doubled or tripled overnight based on updated methodology?
- What benefit and tax structures could smooth the “Valley of Death” without eliminating incentives to work more?
- How do participation costs and thresholds vary across regions, and should the poverty line be locally indexed by default?
- Which existing programs (EITC, CTC, childcare credits) most efficiently move families above a realistic participation threshold?
- How can communication about poverty and class avoid gaslighting people whose lived experience contradicts official stats?
### 🔮 Future Research
- Develop a robust “Participation Cost Index” tracking non-discretionary expenses separately from general CPI.
- Explore longitudinal impacts of phase-change events (bankruptcy, eviction) on lifetime earnings, health, and political behavior.
- Analyze technology’s dual role in raising participation costs (devices, connectivity) while enabling cost-saving alternatives (remote work, telehealth).
- Model family-level outcomes under alternative welfare regimes (universal childcare, universal healthcare, UBI).
- Investigate intergenerational effects of chronically living just below the real survival line on education and mobility.
### 💡 Implications
- Practice: household budgeting and financial advice must shift from generic “save 10%” rules toward recognizing high fixed participation costs and cliffs.
- Policy: official metrics (poverty, inflation) may need overhaul to align with modern spending structures, or risk losing legitimacy.
- Security: economic fragility at incomes once considered comfortable can increase susceptibility to scams, radicalization, and social instability.
- Education: curricula should incorporate realistic economic modeling and benefit cliffs so citizens understand systemic incentives.
- Funding: philanthropy and public funding might prioritize interventions (childcare, housing, healthcare) that most reduce participation costs.
### 🧠 Learning Styles Assessment
- Reading level estimate: roughly 11th–12th grade (Flesch–Kincaid–style inference from sentence length, vocabulary, and abstract economic terminology).
#### 👀 Visual learners
- Present: conceptual metaphors (phase change, Valley of Death) but few actual charts/diagrams in the text.
- Improve: add side-by-side budget tables, timelines of cost growth, and graphs of benefit cliffs vs. income.
#### 🔊 Aural learners
- Present: strong narrative voice and quotable lines, but no explicit audio.
- Improve: provide a 3–5 minute audio summary or podcast segment walking through the core budget and participation concepts.
#### 🗣️ Verbal learners
- Present: rich analogies (“participation tickets,” “Valley of Death,” “phase change”), clear definitions of key terms.
- Improve: glossary of economic terms (hedonic adjustment, CPI, OPM) and explicit comparative definitions.
#### 🧩 Kinesthetic learners
- Present: implied “budget-building” exercise but not interactive.
- Improve: worksheets where readers construct their own Basic Needs budget and map benefit cliffs.
#### 🧠 Logical learners
- Present: stepwise derivation from Orshansky’s formula to new multiplier; clear causal reasoning about benefit cliffs.
- Improve: formal models, tables of marginal tax rates, and explicit if–then decision trees around income and benefits.
#### 🧑🤝🧑 Social learners
- Present: political and social framing that invites discussion.
- Improve: guided discussion questions or prompts for group analysis of local cost-of-living data.
#### 🧘♀️ Solitary learners
- Present: reflective tone and personal narrative that encourages introspection.
- Improve: journaling prompts on personal budgets, career choices, and perceived social contracts.
#### 🌿 Naturalistic learners
- Present: limited direct environmental or sustainability content.
- Improve: connect housing, transport patterns, and childcare to urban planning, commuting emissions, and ecosystem impacts.
### 📊 Accessibility Assessment
#### Screen reader semantics
- Present: typical article headings and paragraphs are likely readable by screen readers.
- Improve: ensure consistent heading hierarchy and descriptive alt text for any embedded charts.
#### Keyboard navigation
- Present: standard web article likely supports basic tabbing.
- Improve: guarantee focus states, skip links, and avoid any keyboard traps in interactive embeds.
#### Contrast and readability
- Present: depends on site theme; likely acceptable but unverified.
- Improve: confirm at least 4.5:1 contrast, adjustable font sizes, and sufficient line spacing.
#### Text resizing and reflow
- Present: responsive layout likely.
- Improve: test at 200% zoom, support prefers-reduced-motion, and avoid content clipping.
#### Media and captions
- Present: primarily text; any media usage unspecified.
- Improve: captions and transcripts for any future multimedia explanations or data visualizations.
#### Forms and interactions
- Present: minimal interactions (newsletter signups, comments).
- Improve: accessible labels, error messaging, and large click targets.
#### Standards reference
- Map improvements to WCAG 2.2 AA, especially Success Criteria on contrast (1.4.x), reflow (1.4.10), keyboard (2.1.x), and navigation (2.4.x).
### 🌍 DEIB Assessment
#### Cultural breadth
- Present: focuses on US economic context.
- Improve: add comparative perspectives from other countries and note where US-specific structures differ.
#### Inclusive language
- Present: largely inclusive, using “families,” “working poor,” “middle class” rather than stigmatizing labels.
- Improve: clarify that examples are illustrative, not exhaustive of all family structures.
#### Neurodiversity support
- Present: structured into sections, with recurring metaphors to aid memory.
- Improve: shorter paragraphs, more subheadings, and visual summaries for readers needing stronger scaffolding.
#### Representation
- Present: author speaks from personal vantage point but references broad groups (immigrants, working poor).
- Improve: include more direct voices (quotes, data) from impacted communities.
#### Psychological safety
- Present: validates economic distress and avoids blaming individuals.
- Improve: content warnings for discussions of poverty and financial ruin; links to support resources where appropriate.
### ✅ Logical Validity
#### Strong reasoning
- Uses causal reasoning from historic budget shares to modern ones, holding methodology constant to expose distortions.
- Applies marginal analysis to benefit cliffs, demonstrating effective tax rates that exceed 100% in some ranges.
- Uses analogical reasoning (phase change, participation tickets) to clarify non-linear dynamics of ruin and structural costs.
#### Fallacies
- Potential risk of overgeneralization: national averages may not fully capture regional variability; this could be mitigated by explicit caveats and more granular data.
- Some rhetorical flourishes could be interpreted as straw-manning “economists,” but the core critique is methodological rather than ad hominem; could be strengthened by naming specific measures and their limitations.
#### Tone of voice
- Tone is urgent, analytical, and empathetic, mixing technical analysis with vivid metaphors and personal reflection.
- Occasionally confrontational toward status-quo defenders, using sharp lines to puncture complacency.
### 🛡️ DARVO Analysis
- Deny: The piece explicitly rejects denial of economic distress; it attacks the idea that low official poverty or “good vibes” charts reflect lived reality.
- Attack: It critiques economic orthodoxy and certain policy narratives but doesn’t target specific vulnerable groups as culprits; instead, it reframes antagonism from working poor toward the poor/immigrants as a system-driven response.
- Reverse victim/offender: The author argues that people officially labeled “middle class” are in fact victims of a benchmark and policy architecture that punishes effort. This is not reversal against poorer groups, but rather a reframing away from blaming them.
- Overall, the essay is more about exposing structural harm than defending an accused actor via DARVO patterns.
## 🎯 Conclusion
- The US poverty line is built on an obsolete food-based formula that dramatically understates what it takes to survive in a world where housing, healthcare, childcare, and participation costs have exploded. When we update the math, many households labeled “middle class” are actually living below a realistic crisis threshold, trapped in a Valley of Death where working harder often makes them poorer. Recognizing and recalibrating this broken benchmark is a prerequisite for designing policies, products, and communities that genuinely increase security rather than deepen quiet ruin.
## 🧱 Refactor Appendix (append after 🎯 Conclusion)
### 📚 Literature Split Pad
- Purpose: Stage Konik CEE units that become per-source Literature notes.
- Split level: **H3**.
- Include verbatim quotes under 25 words and a [view highlight] link.
### [H1] 5–10-word present-tense claim
> [!quote] [Part 1: My Life Is a Lie](https://www.yesigiveafig.com/p/part-1-my-life-is-a-lie?utm_campaign=post&utm_medium=web) by [[Michael W. Green]] via [[yesigiveafig.com]]. Published 2025-11-23.
> “The U.S. poverty line is calculated as three times the cost of a minimum food diet in 1963.”
Two lines: context and use. Cite data if relevant.
[view highlight](https://www.yesigiveafig.com/p/part-1-my-life-is-a-lie?utm_campaign=post&utm_medium=web#H1) #xref #articleseed ID:rw_[MISSING]
### [H2] 5–10-word present-tense claim
> [!quote] [Part 1: My Life Is a Lie](https://www.yesigiveafig.com/p/part-1-my-life-is-a-lie?utm_campaign=post&utm_medium=web)
> “The real poverty line is around $140,000 for a family of four.”
Two lines: context and use.
[view highlight](https://www.yesigiveafig.com/p/part-1-my-life-is-a-lie?utm_campaign=post&utm_medium=web#H2) #xref ID:rw_[MISSING]
---
### 🔖 Atomic Split Pad (Zettel Candidates)
- Purpose: Promote reusable claims into Atomic notes.
- Split level: **H4**.
- Each item: one idea, present tense, specific, testable.
#### [Z1] Real US poverty line approaches $140,000
- For a family of four, applying updated 1963 methodology yields a crisis threshold near $140k.
- Pointer: article’s Basic Needs budget and multiplier discussion.
- Links: [[Poverty-Measurement]] [[Cost-of-Participation]]
#### [Z2] Benefit cliffs create a Valley of Death
- Between roughly $40k and $100k income, benefit loss can exceed wage gains, lowering net income.
- Pointer: article’s New Jersey family example.
- Links: [[Welfare-Policy]] [[Marginal-Tax-Rates]]
---
### ✏️ Fleeting Queue (Extract by Selection)
- Purpose: Capture quick actions or sparks for Fleeting notes.
- Extraction: **Select one line** → “Refactor: Extract selection to new note (content only).”
- Keep each line short and self-contained.
- [F1] Rebuild US poverty metrics around participation costs, not food share — context/https://www.yesigiveafig.com/p/part-1-my-life-is-a-lie?utm_campaign=post&utm_medium=web #fleeting #inbox
- [F2] Model marginal effective tax rates across benefit cliffs for $30k–$120k families — context/https://www.yesigiveafig.com/p/part-1-my-life-is-a-lie?utm_campaign=post&utm_medium=web #fleeting #inbox
- [F3] Design WordPress community pricing and tooling for users effectively poor below $140k — context/https://www.yesigiveafig.com/p/part-1-my-life-is-a-lie?utm_campaign=post&utm_medium=web #fleeting #inbox
---
## 🧰 Template Library (paste into Note Refactor → Refactored Note Template)
<!-- Copy ONE template at a time into the plugin before running each batch. -->
### 📝 Fleeting — Refactored Note Template (Konik-ready)
---
type: fleeting
status: inbox
created: {{date:YYYY-MM-DD}} {{time:HH:mm}}
process_by: {{date:YYYY-MM-DD}} # review within 24–48 hrs
source_title: [MISSING]
source_link:
author: [MISSING]
source_type: article|paper|video|podcast|thread
reading_stage: inspectional|analytical|syntopical
project:
tags: [#fleeting, #inbox]
---
# 📝 Fleeting Note — {{title}}
## 🧠 One-liner (my words)
- State the single idea in one short sentence.
## 🧭 Context & cue
- Where did this arise? Page/timecode/speaker.
- Trigger: quote, data point, claim, or question.
## 🧪 Adler checks (quick)
- What is this about as a whole?
- What is said in detail, and how?
- Is it true? Evidence for or against?
- So what? Impact or next move.
## 🔎 Bias & reliability snapshot
- Possible bias or framing?
- What evidence would change my view?
## 🧩 Konik bridge
- Draft a claim header for promotion.
### [H1] 5–10-word present-tense claim
> [!quote] [{{source_title}}]({{source_link}}) by [[{{author}}]]. Accessed {{date:YYYY-MM-DD}}.
> “Short quote under ~25 words.”
One line on why this matters.
[view highlight]({{source_link}}) #xref ID:rw_[MISSING]
## 🧰 Next moves (pick 1–2)
- [ ] Promote to *Literature* with citation.
- [ ] Draft *Atomic* claim from [H1].
- [ ] Park as testable question.
## ✅ Processing checklist
- [ ] Rewrote in my words.
- [ ] Decided: trash | keep | convert.
- [ ] Linked to at least one related note.
- [ ] Tagged and moved out of inbox.
---
### 📚 Literature — Refactored Note Template (Konik-ready)
---
type: literature
status: draft
created: {{date:YYYY-MM-DD}} {{time:HH:mm}}
adler_level: inspectional|analytical|syntopical
reading_stage: inspectional|analytical|syntopical
source_title: [MISSING]
author: [MISSING]
year:
publisher_or_journal:
edition_or_volume:
doi:
url:
accessed: {{date:YYYY-MM-DD}}
citekey:
project:
tags: [#literature, #reading]
---
# 📚 Literature Note — {{title}}
## 🧰 Action Inbox
- [H1] Short action — context/{{url}} #articleseed
- [H2] Short action — context/{{url}} #xref
- [H3] Short action — context/{{url}} #share
## 🧭 Bib Capsule
- Title, author, year, venue, and link.
- One-line scope: what the work attempts.
## 🧠 Author’s Thesis (their words)
- Core claim briefly. Include page/timecode.
## 🧩 Key Arguments
- Argument A — method/evidence — page/time.
- Argument B — method/evidence — page/time.
- Argument C — method/evidence — page/time.
## 🧪 Evaluation (Adler)
- What is this about as a whole?
- How is it argued? Fairly and clearly?
- Is it true or plausible? Why?
- So what? Practical or theoretical impact.
## 🗒️ Notes (Konik CEE units)
### [H1] 5–10-word present-tense claim
> [!quote] [{{source_title}}]({{url}}) by [[{{author}}]] via [[{{publisher_or_journal}}]]. Published {{year}}. Accessed {{accessed}}.
> “Verbatim highlight under ~25 words.”
Two lines: context and use. Link to data if relevant.
[view highlight]({{url}}#H1) #xref #articleseed ID:rw_[MISSING]
### [H2] 5–10-word present-tense claim
> [!quote] [{{source_title}}]({{url}}) by [[{{author}}]] via [[{{publisher_or_journal}}]]. Published {{year}}. Accessed {{accessed}}.
> “Verbatim highlight under ~25 words.”
Two lines: context and use.
[view highlight]({{url}}#H2) #xref ID:rw_[MISSING]
## 🔖 Zettel Candidates
#### [Z1] 5–10-word present-tense claim
- One-line context and page/time.
#### [Z2] 5–10-word present-tense claim
- One-line context and page/time.
## 🏷️ Tag Coverage
#articleseed: 0 • #xref: 0 • #share: 0 • #bmf: 0 • #addendum: 0
## ✅ Processing Checklist
- [ ] Thesis captured in my words.
- [ ] 1–3 Zettel candidates drafted.
- [ ] Action Inbox pruned to high-signal items.
- [ ] Cross-links added and filed.
---
### 🔖 Atomic (Zettel) — Refactored Note Template (Konik-ready)
---
type: atomic
id: {{date:YYYYMMDDHHmm}}-{{title}}
status: evergreen
created: {{date:YYYY-MM-DD}} {{time:HH:mm}}
origin: reading|thinking|experiment
proof_state: conjecture|working|supported|refuted
source_literature: [[Source-Literature-Note]]
citekey:
project:
tags: [#zettel, #idea]
---
# 🔖 {{title}} <!-- 5–10 words, present tense, specific -->
## 🧠 Claim
- One idea only. Clear and testable.
## 🧾 Evidence & Pointers (Konik)
- [H#] from [[{{source_literature}}]] — page/time — brief rationale.
- ID:rw_[MISSING] — link to highlight or dataset.
> [!quote] Evidence snippet (≤25 words) if essential.
> Cite page/time. Keep it minimal.
## 🔍 Scope & Conditions
- When this holds. Boundaries and exceptions.
## 🔗 Links
- Broader: [[Parent-Concept]]
- Narrower: [[Specific-Case]]
- Related: [[Parallel-Idea]]
## 🧪 Tests / Falsifiers
- One check that could disconfirm the claim.
- Simple study or observation plan.
## 🧰 Implications
- Practice, policy, or design moves in one line each.
## 🔙 Backlinks
- From: [[{{source_literature}}]] • Context line.
## ✅ Maintenance
- [ ] Links in and out.
- [ ] Title still precise?
- [ ] Proof state updated.
```
- Summary: How a Broken Benchmark Quietly Broke America
- URL: https://www.yesigiveafig.com/p/part-1-my-life-is-a-lie?utm_campaign=post&utm_medium=web
##### How a Broken Benchmark Quietly Broke America
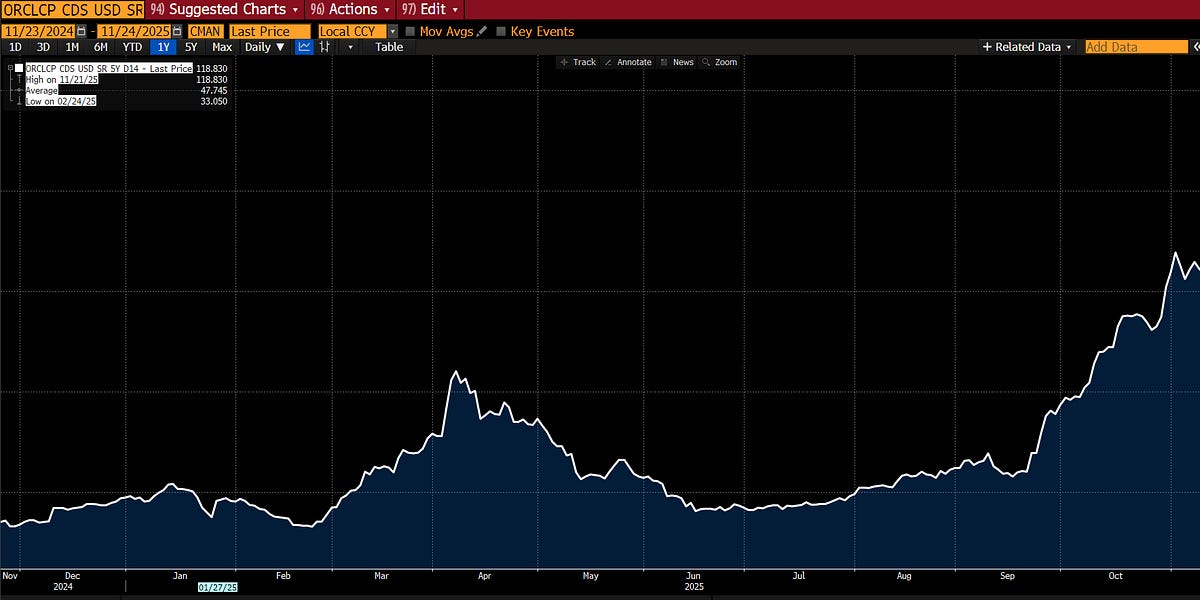
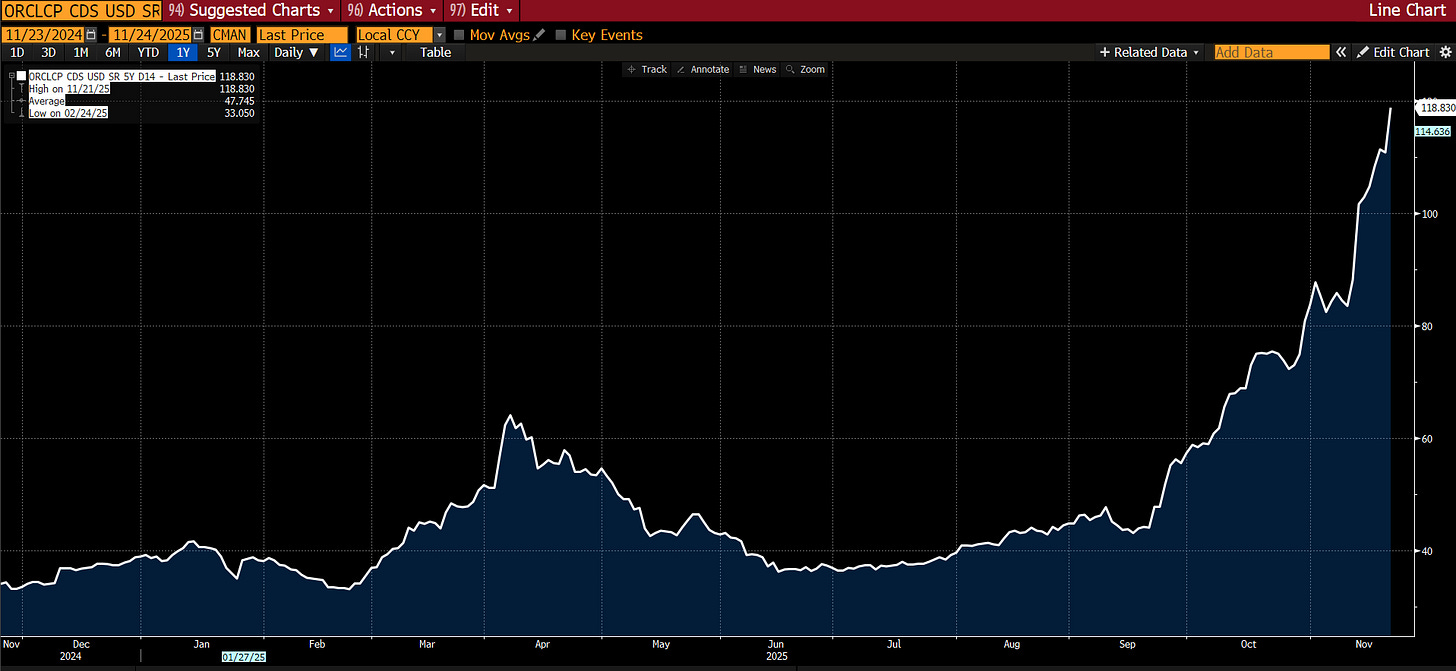
We’re going to largely skip markets again, because the sweater is rapidly unraveling in other areas as I pull on threads. Suffice it to say that the market is LARGELY unfolding as I had expected — credit stress is rising, particularly in the tech sector. Many are now pointing to the rising CDS for Oracle as the deterioration in “AI” balance sheets accelerates. CDS was also JUST introduced for META — it traded at 56, slightly worse than the aggregate IG CDS at 54.5 (itself up from 46 since I began discussing this topic):
[](https://substackcdn.com/image/fetch/$s_!CzZ4!,f_auto,q_auto:good,fl_progressive:steep/https%3A%2F%2Fsubstack-post-media.s3.amazonaws.com%2Fpublic%2Fimages%2Ff2f0ec76-7cae-42ae-88ad-4f35333b4c10_1917x884.png)
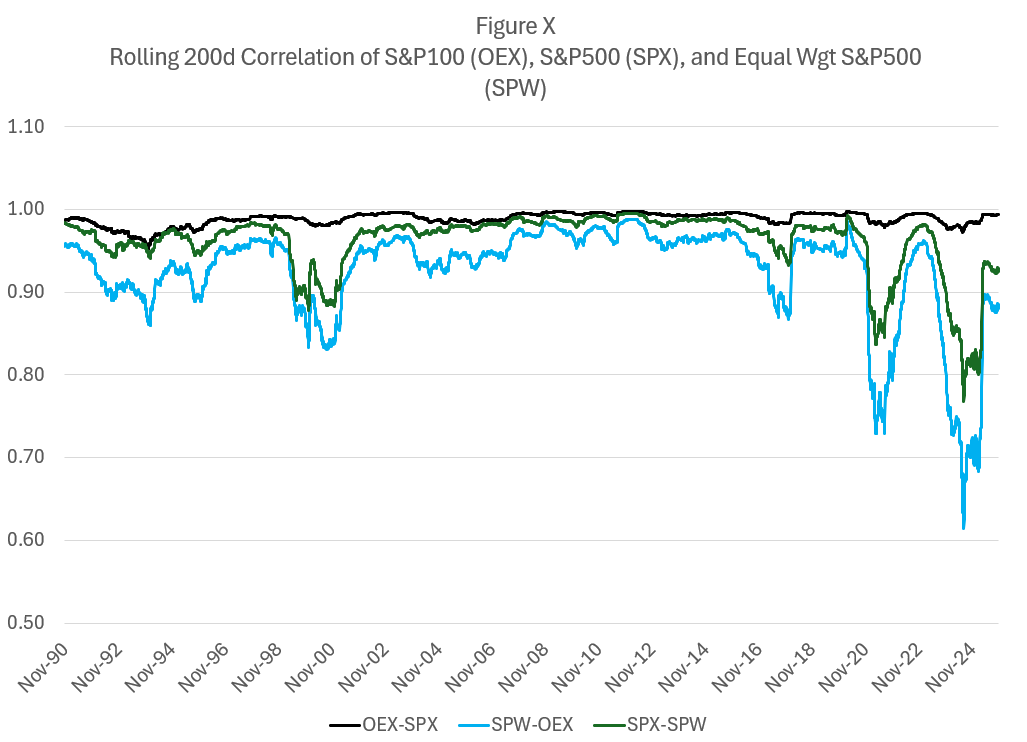
Correlations are spiking as MOST stocks move in the same direction each day even as megacap tech continues to define the market aggregates:
[](https://substackcdn.com/image/fetch/$s_!jWYc!,f_auto,q_auto:good,fl_progressive:steep/https%3A%2F%2Fsubstack-post-media.s3.amazonaws.com%2Fpublic%2Fimages%2Fe2275e18-f9fd-41e1-8f45-b320237b6c86_1027x742.png)
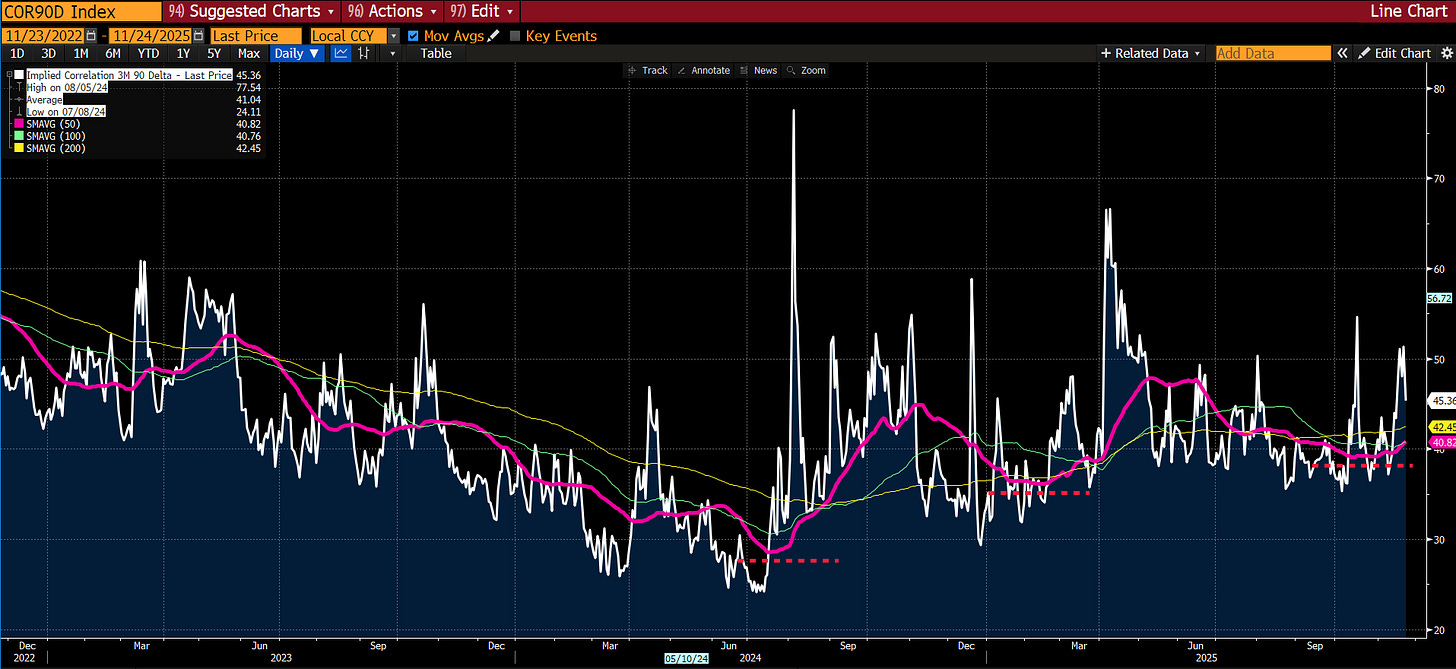
Market pricing of correlation is beginning to pick up… remember this is the “real” fear index and the moving averages are trending upwards:
[](https://substackcdn.com/image/fetch/$s_!eaf8!,f_auto,q_auto:good,fl_progressive:steep/https%3A%2F%2Fsubstack-post-media.s3.amazonaws.com%2Fpublic%2Fimages%2Fa6e7a216-84a8-4502-9ff2-7f89a56934e8_1915x880.png)
And, as I predicted, inflation concerns, notably absent from any market-based indication, are again freezing the Fed. The pilots are frozen, understanding that they are in Zugzwang — every choice has unfavorable options.
[](https://substackcdn.com/image/fetch/$s_!KMm8!,f_auto,q_auto:good,fl_progressive:steep/https%3A%2F%2Fsubstack-post-media.s3.amazonaws.com%2Fpublic%2Fimages%2F3b653b38-203d-404a-83bd-7073508a7c83_290x174.jpeg)
And so now, let’s tug on that loose thread… I’m sure many of my left-leaning readers will say, “This is obvious, we have been talking about it for YEARS!” Yes, many of you have; but you were using language of emotion (“Pay a living wage!”) rather than showing the math. My bad for not paying closer attention; your bad for not showing your work or coming up with workable solutions. Let’s rectify it rather than cast blame.
##### How a Broken Benchmark Quietly Broke America
I have spent my career distrusting the obvious.
Markets, liquidity, factor models—none of these ever felt self-evident to me. Markets are mechanisms of price clearing. Mechanisms have parameters. Parameters distort outcomes. This is the lens through which I learned to see everything: find the parameter, find the distortion, find the opportunity.
But there was one number I had somehow never interrogated. One number that I simply accepted, the way a child accepts gravity.
The poverty line.
I don’t know why. It seemed apolitical, an actuarial fact calculated by serious people in government offices. A line someone else drew decades ago that we use to define who is “poor,” who is “middle class,” and who deserves help. It was infrastructure—invisible, unquestioned, foundational.
This week, while trying to understand why the American middle class feels poorer each year despite healthy GDP growth and low unemployment, I came across a sentence buried in a research paper:
“The U.S. poverty line is calculated as three times the cost of a minimum food diet in 1963, adjusted for inflation.”
I read it again. Three times the minimum food budget.
I felt sick.
##### The Measurement Failure
The formula was developed by Mollie Orshansky, an economist at the Social Security Administration. In 1963, she observed that families spent roughly one-third of their income on groceries. Since pricing data was hard to come by for many items, e.g. housing, if you could calculate a minimum adequate food budget at the grocery store, you could multiply by three and establish a poverty line.
Orshansky was careful about what she was measuring. In her January 1965 article, she presented the poverty thresholds as a measure of income *inadequacy*, not income adequacy—”if it is not possible to state unequivocally ‘how much is enough,’ it should be possible to assert with confidence how much, on average, is too little.”
She was drawing a floor. A line below which families were clearly in crisis.
For 1963, that floor made sense. Housing was relatively cheap. A family could rent a decent apartment or buy a home on a single income, as we’ve discussed. Healthcare was provided by employers and cost relatively little (Blue Cross coverage averaged $10/month). Childcare didn’t really exist as a market—mothers stayed home, family helped, or neighbors (who likely had someone home) watched each other’s kids. Cars were affordable, if prone to breakdowns. With few luxury frills, the neighborhood kids in vo-tech could fix most problems when they did. College tuition could be covered with a summer job. Retirement meant a pension income, not a pile of 401(k) assets you had to fund yourself.
Orshansky’s food-times-three formula was crude, but as a **crisis** threshold—a measure of “too little”—it roughly corresponded to reality. A family spending one-third of its income on food would spend the other two-thirds on everything else, and those proportions more or less worked. Below that line, you were in genuine crisis. Above it, you had a fighting chance.
But everything changed between 1963 and 2024.
Housing costs exploded. Healthcare became the largest household expense for many families. Employer coverage shrank while deductibles grew. Childcare became a market, and that market became ruinously expensive. College went from affordable to crippling. Transportation costs rose as cities sprawled and public transit withered under government neglect.
The labor model shifted. A second income became mandatory to maintain the standard of living that one income formerly provided. But a second income meant childcare became mandatory, which meant two cars became mandatory. Or maybe you’d simply be “asking for a lot generationally speaking” because living near your parents helps to defray those childcare costs.
The composition of household spending transformed completely. In 2024, food-at-home is no longer 33% of household spending. For most families, it’s 5 to 7 percent.
Housing now consumes 35 to 45 percent. Healthcare takes 15 to 25 percent. Childcare, for families with young children, can eat 20 to 40 percent.
If you keep Orshansky’s logic—if you maintain her principle that poverty could be defined by the inverse of food’s budget share—but update the food share to reflect today’s reality, the multiplier is no longer three.
It becomes sixteen.
Which means if you measured income inadequacy today the way Orshansky measured it in 1963, the threshold for a family of four wouldn’t be $31,200.
It would be somewhere between $130,000 and $150,000.
And remember: Orshansky was only trying to define “too little.” She was identifying crisis, not sufficiency. If the crisis threshold—the floor below which families cannot function—is honestly updated to current spending patterns, it lands at $140,000.
What does that tell you about the $31,200 line we still use?
It tells you we are measuring starvation.
***“An imbalance between rich and poor is the oldest and most fatal ailment of all republics.” — Plutarch***
##### The Real Math of Survival
The official poverty line for a family of four in 2024 is $31,200. The median household income is roughly $80,000. We have been told, implicitly, that a family earning $80,000 is doing fine—safely above poverty, solidly middle class, perhaps comfortable.
But if Orshansky’s crisis threshold were calculated today using her own methodology, that $80,000 family would be living in deep poverty.
I wanted to see what would happen if I ignored the official stats and simply calculated the cost of existing. I built a Basic Needs budget for a family of four (two earners, two kids). No vacations, no Netflix, no luxury. Just the “Participation Tickets” required to hold a job and raise kids in 2024.
Using conservative, national-average data:
Childcare: $32,773
Housing: $23,267
Food: $14,717
Transportation: $14,828
Healthcare: $10,567
Other essentials: $21,857
Required net income: $118,009
Add federal, state, and FICA taxes of roughly $18,500, and you arrive at a required gross income of $136,500.
This is Orshansky’s “too little” threshold, updated honestly. This is the floor.
The single largest line item isn’t housing. It’s childcare: $32,773.
This is the trap. To reach the median household income of $80,000, most families require two earners. But the moment you add the second earner to chase that income, you trigger the childcare expense.
If one parent stays home, the income drops to $40,000 or $50,000—well below what’s needed to survive. If both parents work to hit $100,000, they hand over $32,000 to a daycare center.
The second earner isn’t working for a vacation or a boat. The second earner is working to pay the stranger watching their children so they can go to work and clear $1-2K extra a month. It’s a closed loop.
##### The Housing Lie (Or, Why the Model Is Optimistic)
Critics will immediately argue that I’m cherry-picking expensive cities. They will say $136,500 is a number for San Francisco or Manhattan, not “Real America.”
So let’s look at “Real America.”
The model above allocates $23,267 per year for housing. That breaks down to $1,938 per month. This is the number that serious economists use to tell you that you’re doing fine.
In my last piece, *[Are You An American?](https://www.yesigiveafig.com/p/are-you-an-american?r=lyypr)*, I analyzed a modest “starter home” which turned out to be in Caldwell, New Jersey—the kind of place a Teamster could afford in 1955. I went to Zillow to see what it costs to live in that same town if you don’t have a down payment and are forced to rent.
There are exactly seven 2-bedroom+ units available in the entire town. The cheapest one rents for $2,715 per month.
That’s a $777 monthly gap between the model and reality. That’s $9,300 a year in post-tax money. To cover that gap, you need to earn an additional $12,000 to $13,000 in gross salary.
So when I say the real poverty line is $140,000, I’m being conservative. I’m using optimistic, national-average housing assumptions. If we plug in the actual cost of living in the zip codes where the jobs are—where rent is $2,700, not $1,900—the threshold pushes past $160,000.
The market isn’t just expensive; it’s broken. Seven units available in a town of thousands? That isn’t a market. That’s a shortage masquerading as an auction.
And that $2,715 rent check buys you zero equity. In the 1950s, the monthly housing cost was a forced savings account that built generational wealth. Today, it’s a subscription fee for a roof. You are paying a premium to stand still.
##### The Hedonic “Lie”: Why a Phone Costs $200, Not $58
Economists will look at my $140,000 figure and scream about “hedonic adjustments.” Heck, I will scream at you about them. They are valid attempts to measure the improvement in quality that we honestly value.
I will tell you that comparing 1955 to 2024 is unfair because cars today have airbags, homes have air conditioning, and phones are supercomputers. I will argue that because the quality of the good improved, the real price dropped.
And I would be making a category error. We are not calculating the price of luxury. We are calculating the price of participation.
To function in 1955 society—to have a job, call a doctor, and be a citizen—you needed a telephone line. That “Participation Ticket” cost $5 a month.
Adjusted for standard inflation, that $5 should be $58 today.
But you cannot run a household in 2024 on a $58 landline. To function today—to factor authenticate your bank account, to answer work emails, to check your child’s school portal (which is now digital-only)—you need a smartphone plan and home broadband.
The cost of that “Participation Ticket” for a family of four is not $58. It’s $200 a month.
The economists say, “But look at the computing power you get!”
I say, “Look at the computing power I **need**!”
The utility I’m buying is “connection to the economy.” The price of that utility didn’t just keep pace with inflation; it tripled relative to it.
I ran this “Participation Audit” across the entire 1955 budget. I didn’t ask “is the car better?” I asked “what does it cost to get to work?”
Healthcare: In 1955, Blue Cross family coverage was roughly $10/month ($115 in today’s dollars). Today, the average family premium is over $1,600/month. That’s 14x inflation.
Taxes (FICA): In 1955, the Social Security tax was 2.0% on the first $4,200 of income. The maximum annual contribution was $84. Adjusted for inflation, that’s about $960 a year. Today, a family earning the median $80,000 pays over $6,100. That’s 6x inflation.
Childcare: In 1955, this cost was zero because the economy supported a single-earner model. Today, it’s $32,000. That’s an infinite increase in the cost of participation.
The only thing that actually tracked official CPI was… food. Everything else—the inescapable fees required to hold a job, stay healthy, and raise children—inflated at multiples of the official rate when considered on a participation basis. YES, these goods and services are BETTER. I would not trade my 65” 4K TV mounted flat on the wall for a 25” CRT dominating my living room; but I don’t have a choice, either.
##### The Valley of Death: Why $100,000 Is the New Poor
Once I established that $136,500 is the real break-even point, I ran the numbers on what happens to a family climbing the ladder toward that number.
What I found explains the “vibes” of the economy better than any CPI print.
Our entire safety net is designed to catch people at the very bottom, but it sets a trap for anyone trying to climb out. As income rises from $40,000 to $100,000, benefits disappear faster than wages increase.
I call this The Valley of Death.
Let’s look at the transition for a family in New Jersey:
**1. The View from $35,000 (The “Official” Poor)**
At this income, the family is struggling, but the state provides a floor. They qualify for Medicaid (free healthcare). They receive SNAP (food stamps). They receive heavy childcare subsidies. Their deficits are real, but capped.
**2. The Cliff at $45,000 (The Healthcare Trap)**
The family earns a $10,000 raise. Good news? No. At this level, the parents lose Medicaid eligibility. Suddenly, they must pay premiums and deductibles.
* Income Gain: +$10,000
* Expense Increase: +$10,567
* Net Result: They are poorer than before. The effective tax on this mobility is over 100%.
**3. The Cliff at $65,000 (The Childcare Trap)**
This is the breaker. The family works harder. They get promoted to $65,000. They are now solidly “Working Class.”
But at roughly this level, childcare subsidies vanish. They must now pay the full market rate for daycare.
* Income Gain: +$20,000 (from $45k)
* Expense Increase: +$28,000 (jumping from co-pays to full tuition)
* Net Result: Total collapse.
When you run the net-income numbers, a family earning $100,000 is effectively in a worse monthly financial position than a family earning $40,000.
At $40,000, you are drowning, but the state gives you a life vest. At $100,000, you are drowning, but the state says you are a “high earner” and ties an anchor to your ankle called “Market Price.”
In option terms, the government has sold a call option to the poor, but they’ve rigged the gamma. As you move “closer to the money” (self-sufficiency), the delta collapses. For every dollar of effort you put in, the system confiscates 70 to 100 cents.
No rational trader would take that trade. Yet we wonder why labor force participation lags. It’s not a mystery. It’s math.
##### The Physics of Ruin: The Phase Change
The most dangerous lie of modern economics is “Mean Reversion.” Economists assume that if a family falls into debt or bankruptcy, they can simply save their way back to the average.
They are confusing Volatility with Ruin.
Falling below the line isn’t like cooling water; it’s like freezing it. It is a Phase Change.
When a family hits the barrier—eviction, bankruptcy, or default—they don’t just have “less money.” They become Economically Inert.
* They are barred from the credit system (often for 7–10 years).
* They are barred from the prime rental market (landlord screens).
* They are barred from employment in sensitive sectors.
In physics, it takes massive “Latent Heat” to turn ice back into water. In economics, the energy required to reverse a bankruptcy is exponentially higher than the energy required to pay a bill.
The $140,000 line matters because it is the buffer against this Phase Change. If you are earning $80,000 with $79,000 in fixed costs, you are not stable. You are super-cooled water. One shock—a transmission failure, a broken arm—and you freeze instantly.
##### The Lockdown Arbitrage: Proof of Concept
If you need proof that the cost of participating, the cost of **working,** is the primary driver of this fragility, look at the Covid lockdowns.
In April 2020, the US personal savings rate hit a historic 33%. Economists attributed this to stimulus checks. But the math tells a different story.
During lockdown, the “Valley of Death” was temporarily filled.
* Childcare ($32k): Suspended. Kids were home.
* Commuting ($15k): Suspended.
* Work Lunches/Clothes ($5k): Suspended.
For a median family, the “Cost of Participation” in the economy is roughly $50,000 a year. When the economy stopped, that tax was repealed. Families earning $80,000 suddenly felt rich—not because they earned more, but because the leak in the bucket was plugged. For many, income actually rose thanks to the $600/week unemployment boost. But even for those whose income stayed flat, they felt rich because many costs were avoided.
When the world reopened, the costs returned, but now inflated by 20%. The rage we feel today is the hangover from that brief moment where the American Option was momentarily back in the money. Those with formal training in economics have dismissed these concerns, by and large. “Inflation” is the rate of change in the price level; these poor, deluded souls were outraged at the price LEVEL. Tut, tut… can’t have deflation now, can we? We promise you will like THAT even less.
But the price level does mean something, too. If you are below the ACTUAL poverty line, you are suffering constant deprivation; and a higher price level means you get even less in aggregate.
##### The Politics of Drowning
*You load sixteen tons, what do you get?
Another day older and deeper in debt
Saint Peter, don’t you call me, ‘cause I can’t go
I owe my soul to the company store — Merle Travis, 1946*
This mathematical valley explains the rage we see in the American electorate, specifically the animosity the “working poor” (the middle class) feel toward the “actual poor” and immigrants.
Economists and politicians look at this anger and call it racism, or lack of empathy. They are missing the mechanism.
Altruism is a function of surplus. It is easy to be charitable when you have excess capacity. It is impossible to be charitable when you are fighting for the last bruised banana.
The family earning $65,000—the family that just lost their subsidies and is paying $32,000 for daycare and $12,000 for healthcare deductibles—is hyper-aware of the family earning $30,000 and getting subsidized food, rent, childcare, and healthcare.
They see the neighbor at the grocery store using an EBT card while they put items back on the shelf. They see the immigrant family receiving emergency housing support while they face eviction.
They are not seeing “poverty.” They are seeing people getting for free the exact things that they are working 60 hours a week to barely afford. And even worse, even if THEY don’t see these things first hand… they are being shown them:
[](https://substackcdn.com/image/fetch/$s_!ocXI!,f_auto,q_auto:good,fl_progressive:steep/https%3A%2F%2Fsubstack-post-media.s3.amazonaws.com%2Fpublic%2Fimages%2Fda0e04ad-f82b-4a9f-b86d-47fa77043371_680x608.png)
The anger isn’t about the goods. It’s about the breach of contract. The American Deal was that Effort ~ Security. Effort brought your Hope strike closer. But because the real poverty line is $140,000, effort no longer yields security or progress; it brings risk, exhaustion, and debt.
When you are drowning, and you see the lifeguard throw a life vest to the person treading water next to you—a person who isn’t swimming as hard as you are—you don’t feel happiness for them. You feel a homicidal rage at the lifeguard.
We have created a system where the only way to survive is to be destitute enough to qualify for aid, or rich enough to ignore the cost. Everyone in the middle is being cannibalized. The rich know this… and they are increasingly opting out of the shared spaces:
##### The Optical Illusion of Prosperity
If you need visual proof of this benchmark error, look at the charts that economists love to share on social media to prove that “vibes” are wrong and the economy is great.
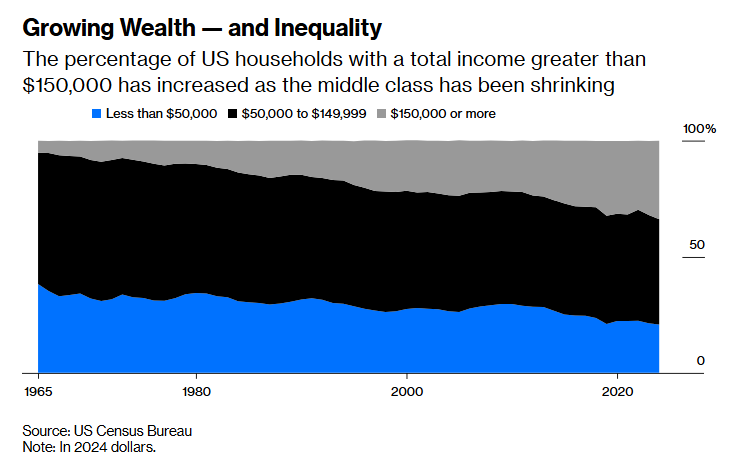
You’ve likely seen this chart. It shows that the American middle class is shrinking not because people are getting poorer, but because they’re “moving up” into the $150,000+ bracket.
The economists look at this and cheer. “Look!” they say. “In 1967, only 5% of families made over $150,000 (adjusted for inflation). Now, 34% do! We are a nation of rising aristocrats.”
[](https://www.bloomberg.com/opinion/articles/2025-11-20/the-american-middle-class-is-shrinking-and-that-s-ok)
But look at that chart through the lens of the real poverty line.
If the cost of basic self-sufficiency for a family of four—housing, childcare, healthcare, transportation—is $140,000, then that top light-blue tier isn’t “Upper Class.”
It’s the Survival Line.
This chart doesn’t show that 34% of Americans are rich. It shows that only 34% of Americans have managed to escape deprivation. It shows that the “Middle Class” (the dark blue section between $50,000 and $150,000)—roughly 45% of the country—is actually the Working Poor. These are the families earning enough to lose their benefits but not enough to pay for childcare and rent. They are the ones trapped in the Valley of Death.
But the commentary tells us something different:
*“Americans earned more for several reasons. The first is that neoliberal economic policies [worked as intended](https://www.bloomberg.com/opinion/articles/2024-06-10/bidenomics-neoliberalism-worked-pretty-well-actually). In the last 50 years, there have been big increases in productivity, solid GDP growth and, since the 1980s, low and predictable inflation. All this helped make most Americans richer.”*
“*neoliberal economic policies [worked as intended](https://www.bloomberg.com/opinion/articles/2024-06-10/bidenomics-neoliberalism-worked-pretty-well-actually)” —* read that again. With [POSIWID](https://www.yesigiveafig.com/p/control-theory-or-proof-of-a-system) (the purpose of a system is what it does) in mind.
The chart isn’t measuring prosperity. It’s measuring inflation in the non-discretionary basket. It tells us that to live a 1967 middle-class life in 2024, you need a “wealthy” income.
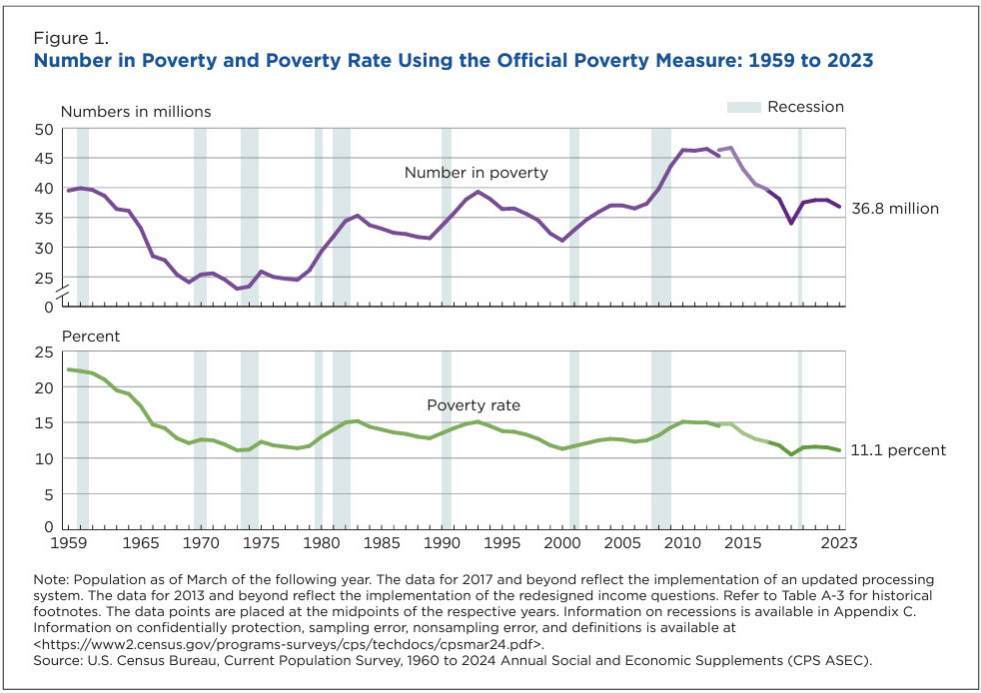
And then there’s this chart, the shield used by every defender of the status quo:
Poverty has collapsed to 11%. The policies worked as intended!
[](https://substackcdn.com/image/fetch/$s_!uyhT!,f_auto,q_auto:good,fl_progressive:steep/https%3A%2F%2Fsubstack-post-media.s3.amazonaws.com%2Fpublic%2Fimages%2F045f58ea-7110-41c3-bf8f-672d43444eca_981x693.png)
But remember Mollie Orshansky. This chart is measuring the percentage of Americans who cannot afford a minimum food diet multiplied by three.
It’s not measuring who can afford rent (which is up 4x relative to wages). It’s not measuring who can afford childcare (which is up infinite percent). It’s measuring starvation.
Of course the line is going down. We are an agricultural superpower who opened our markets to even cheaper foreign food. Shrimp from Vietnam, tilapia from… don’t ask. Food is cheap. But life is expensive.
When you see these charts, don’t let them gaslight you. They are using broken rulers to measure a broken house. The top chart proves that you need $150,000 to make it. The bottom chart proves they refuse to admit it.
##### The Lie
So that’s the trap. The real poverty line—the threshold where a family can afford housing, healthcare, childcare, and transportation without relying on means-tested benefits—isn’t $31,200.
It’s ~$140,000.
Most of my readers will have cleared this threshold. My parents never really did, but I was born lucky — brains, beauty (in the eye of the beholder admittedly), height (it really does help), parents that encouraged and sacrificed for education (even as the stress of those sacrifices eventually drove my mother clinically insane), and an American citizenship. But most of my readers are now seeing this trap for their children.
And the system is designed to prevent them from escaping. Every dollar you earn climbing from $40,000 to $100,000 triggers benefit losses that exceed your income gains. You are literally poorer for working harder.
The economists will tell you this is fine because you’re building wealth. Your 401(k) is growing. Your home equity is rising. You’re richer than you feel.
Next week, I’ll show you why that’s wrong. And THEN we can’t start the discussion of how to rebuild. Because we can.
The wealth you’re counting on—the retirement accounts, the home equity, the “nest egg” that’s supposed to make this all worthwhile—is just as fake as the poverty line. But the humans behind that wealth are real. And they are amazing., Part 1: My Life Is a Lie, Michael W. Green, 01kb05ttvv3k1gb2fppasgy13s.